Page 251 - Konsep Final Disertasi Agung S. 23 April 2024
P. 251

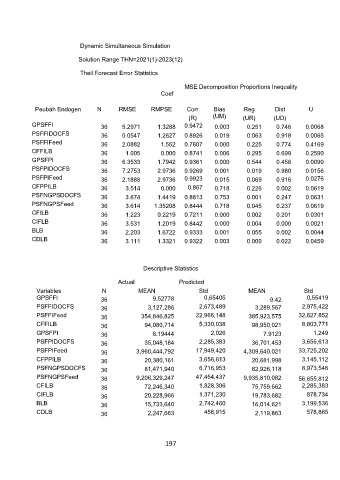
Dynamic Simultaneous Simulation

                                    Solution Range THN=2021(1)-2023(12)

                                     Theil Forecast Error Statistics

                                                         MSE Decomposition Proportions Inequality
                                                  Coef

            Peubah Endogen     N     RMSE      RMPSE      Corr    Bias     Reg      Dist       U
                                                          (R)     (UM)     (UR)     (UD)
           GPSFFI               36    5.2971        1.3288      0.9472   0.003   0.251   0.746   0.0068
           PSFFIDOCFS           36    0.0547        1.2627     0.8926   0.019   0.063   0.918   0.0065
           PSFFIFeed            36    2.0882          1.552     0.7607   0.000   0.225   0.774   0.4169
           CFFILB               36     1.005      0.000   0.8741   0.006    0.295    0.699    0.2590
           GPSFPI               36    6.3533        1.7942     0.9361   0.000   0.544   0.456   0.0090
           PSFPIDOCFS           36    7.2753        2.9736     0.9269   0.001   0.019   0.980   0.0156
           PSFPIFeed            36    2.1888        2.9736      0.9923   0.015   0.069   0.916   0.0276
           CFPPILB              36     3.514            0.000   0.867   0.718   0.226   0.002   0.0619
           PSFNGPSDOCFS         36     3.674       1.4419     0.8813   0.753   0.001   0.247   0.0631
           PSFNGPSFeed          36     3.614      1.35208     0.8444   0.718   0.045   0.237   0.0619
           CFILB                36     1.223        0.2219     0.7211   0.000   0.002   0.201   0.0301
           CIFLB                36     3.531        1.2019     0.8442   0.000   0.004   0.000   0.0021
           BLB                  36     2.203        1.6722     0.9333   0.001   0.055   0.002   0.0044
           CDLB                 36     3.111        1.3321     0.9322   0.003   0.000   0.022   0.0459


                                             Descriptive Statistics

                                                            Actual                           Predicted
            Variables           N          MEAN              Std            MEAN             Std
            GPSFFI              36             9.52778         0,65405             9.42       0,55419
            PSFFIDOCFS          36            3,127,286      2,673,489        3,289,567      2,975,422
            PSFFIFeed           36          354,846,825     22,966,148      385,923,575     32,627,852
            CFFILB              36           94,080,714      5,330,038       98,950,021      8,803,771
            GPSFPI              36             8.19444           2,026           7.9123         1,249
            PSFPIDOCFS          36           35,048,184      2,285,383       36,701,453      3,656,613
            PSFPIFeed           36        3,960,444,792     17,949,420     4,309,640,021    33,725,202
            CFPPILB             36           20,380,161      3,656,613       20,681,998      3,145,112
            PSFNGPSDOCFS        36           81,471,940      6,716,953       82,926,118      8,973,546
            PSFNGPSFeed         36        9,206,329,247     47,454,437     9,935,810,082    56,655,812
            CFILB               36           72,246,340      1,828,306       75,759,662      2,285,383
            CIFLB               36           20,228,966      1,371,230       19,783,682       878,734
            BLB                 36           15,733,640      2,742,460       16,014,621      3,199,536
            CDLB                36            2,247,663        458,915        2,119,863       578,865


                                                   197
   246   247   248   249   250   251   252   253   254   255   256